


Visualizing the Tree of Life
Click on the image for a high resolution jpg file. Old older version with 76425 species is here. An interactive version is here.
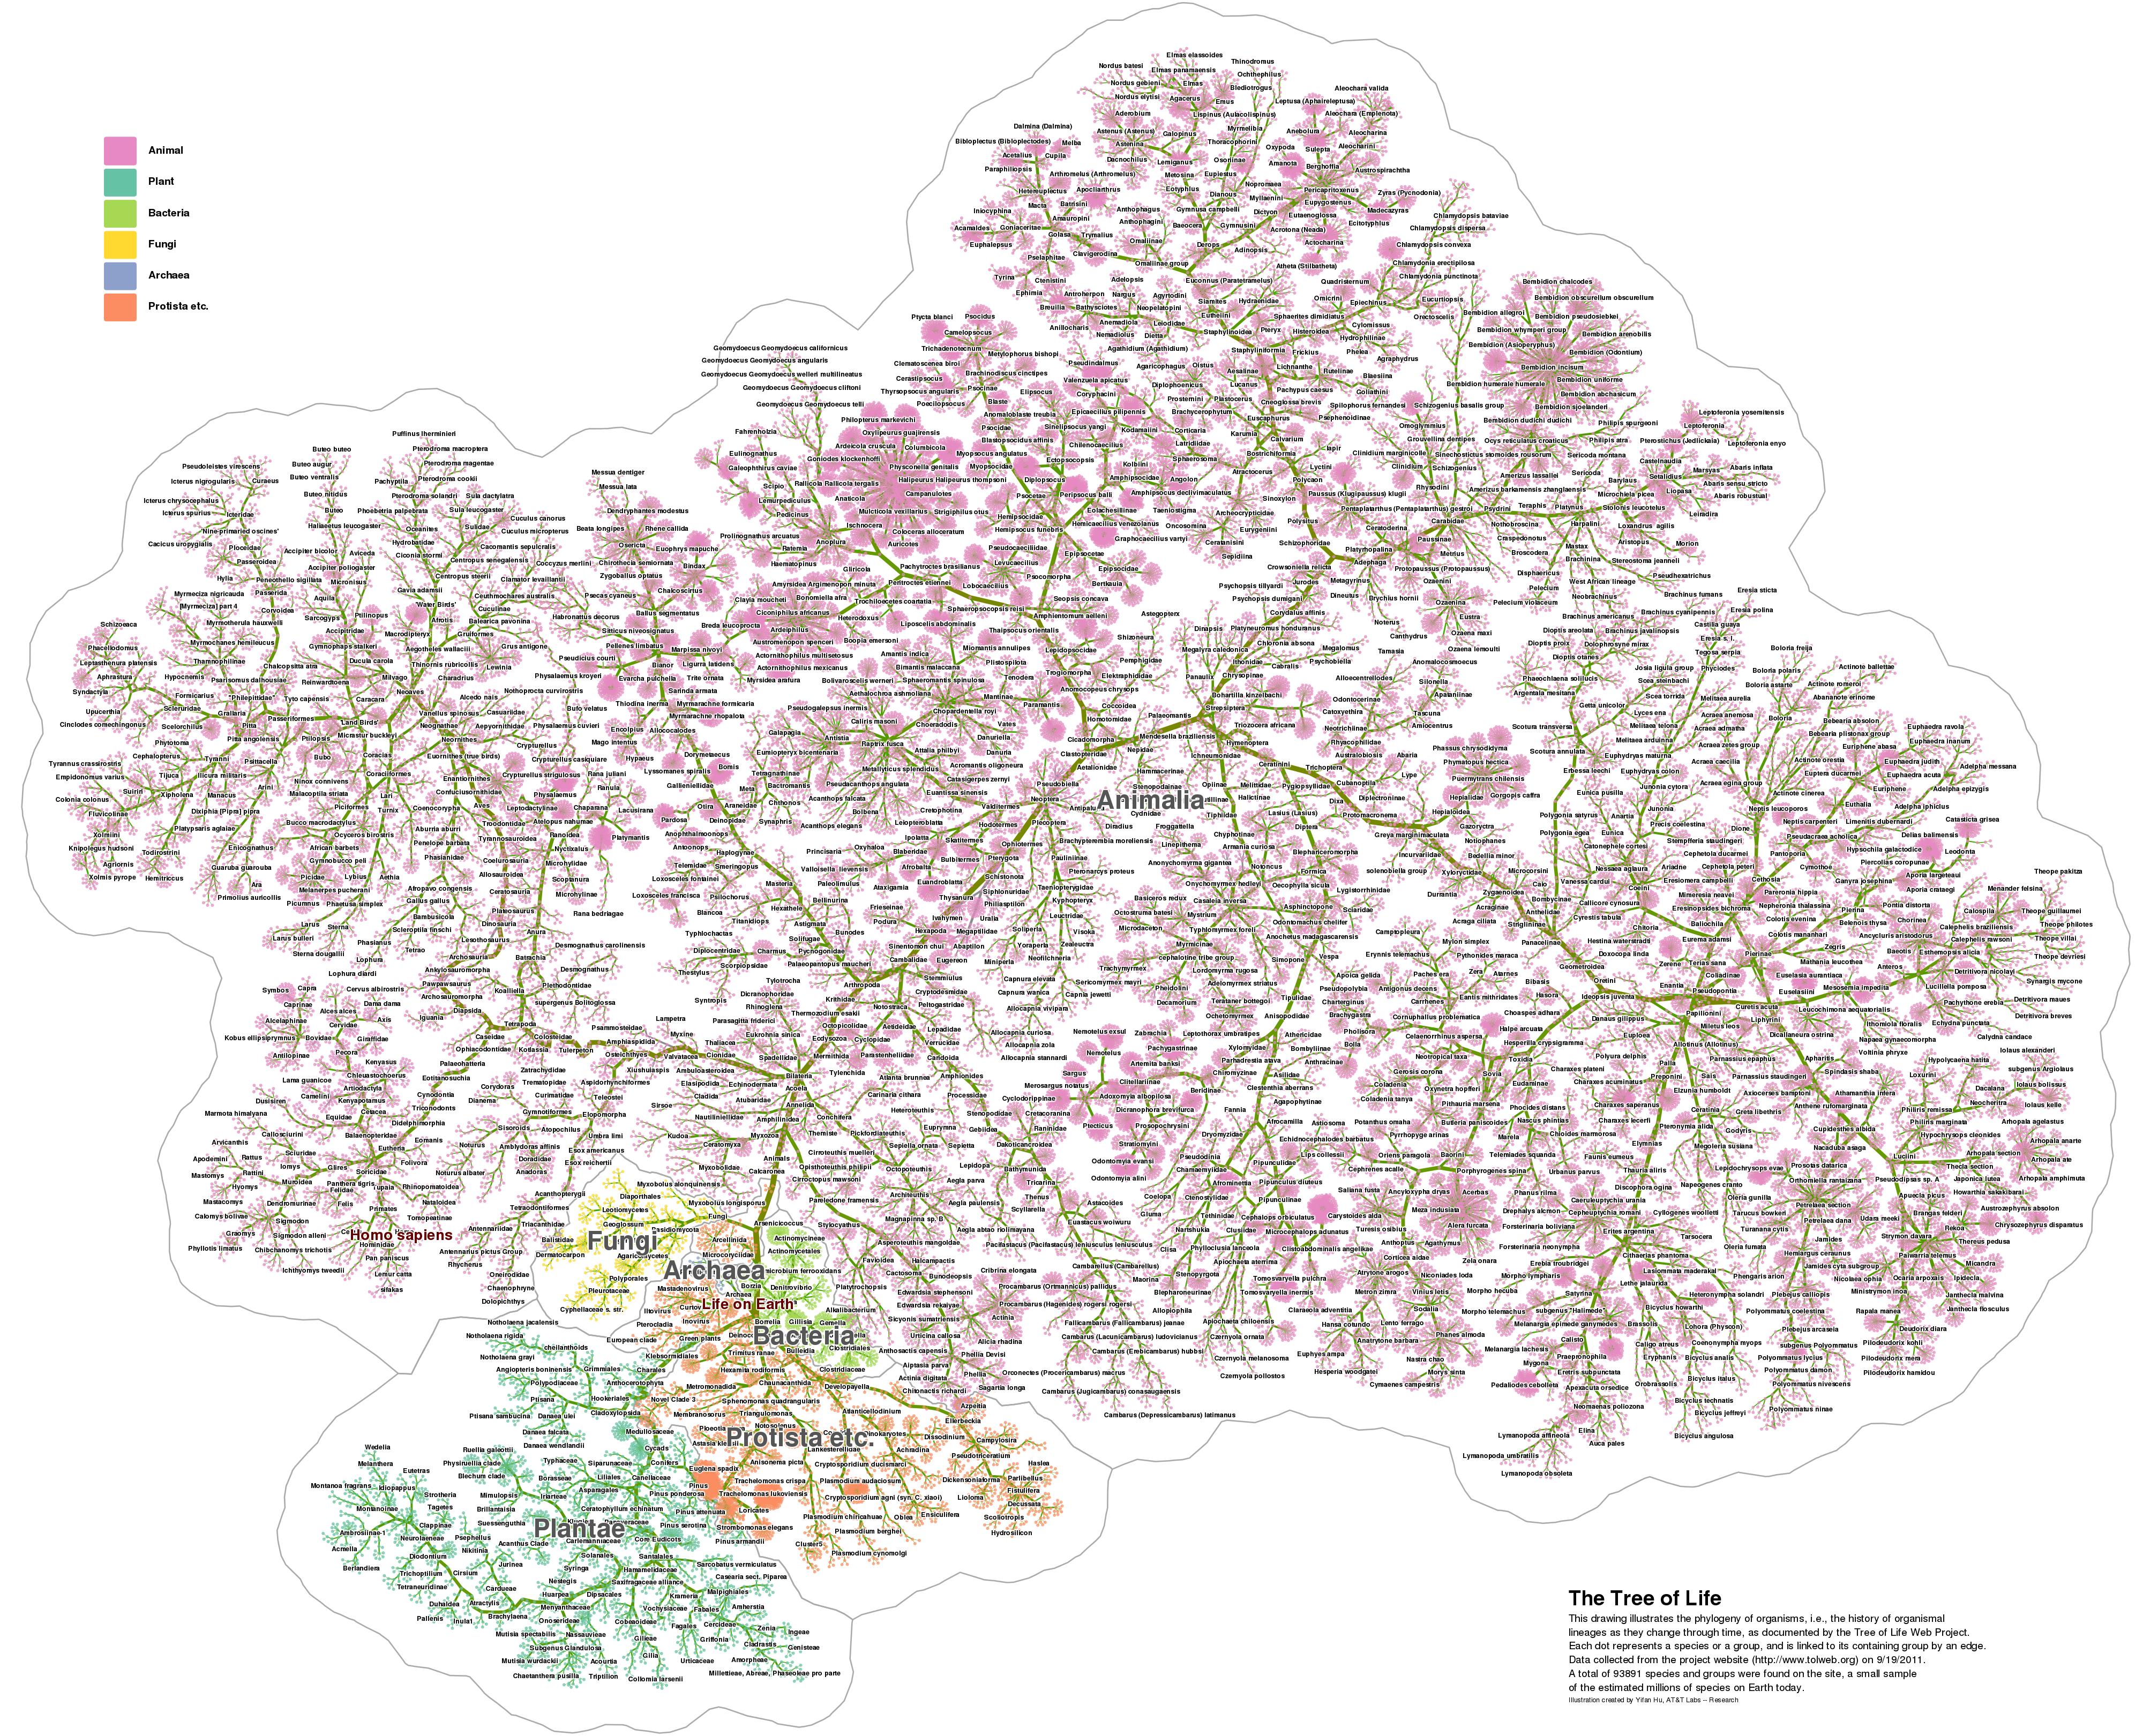
This is a drawing of the tree of life. Data from the Tree of Life project. This project documents phylogeny of organisms, i.e., the history of organismal lineages as they change through time. It implies that different species arise from previous forms via descent, and that all organisms are connected by the passage of genes along the branches of the phylogenetic tree. The data used in this drawing contains 93891 species, representing a tiny fraction of the estimated 5 to 100 million species on Earth today. But even at this scale, traditional graph/tree drawing algorithms could not give a good view of this tree. In this drawing we employed a high performance graph layout algorithm [1,2] that over come the perihperal effect of force dircted algoriths, and gives an aesthetic layout of a tree representing the genetic linkage of species. Gray branches lead to species that are extinct. The drawing clearly shows the tree structure. The root vertex ``Life on Earth'' (shown in red) sits near the southwest of the tree; to its southwest are ``Green plants'' and its descendants; to the southeast are animals. Fungi are just northwest of it. There are many more animals than plants, a reflection of the data itself. Also shown in red is Homo Sapiens.
[1] Yifan Hu and Yehuda Koren, Extending the Spring-Electrical Model to Overcome Warping Effects, proceeding of IEEE Pacific Visualization Symposium, Beijing, China, 2009.
[2] Yifan Hu, Efficient and high quality force-directed graph drawing . The Mathematica Journal, 10 (37-71), 2005.